I have an R cheat sheet, How Big Is Your Graph, that explains how to measure the size of various features of your graph in R. This blog post illustrates how you can use some of the commands described in that cheat sheet to rotate text to match a diagonal line in an R graph. It’s trickier than it seems.
p>There are times when you want to put text on a diagonal slope, rather than vertical or horizontal. Diagonals are tricky because you need to adjust between the slope as measured in terms of the x-y coordinates and the slope as measured in terms of the physical plot itself, typically in pixels. Here’s an example where you might want diagonal text.
plot(0, 0, xlim=c(0, 20), ylim=c(0, 100), type="n", xlab=" ", ylab=" ")
x0 <-  5
x1 <- 10
x2 <- 15
y0 <- 20
y1 <- 50
y2 <- 80
lines(x=c(x0, x2, x2, x0), y=c(y0, y0, y2, y0))
text(x1, y0-1.5*strheight("a", units="user"), "a")
text(x2+1.5*strwidth("b", units="user"), y1, "b")
delta.x <- x2 - x0
delta.y <- y2 - y0
ctext <- expression(sqrt(a^2+b^2))
text(x1, y1+1.5*strheight(ctext, units="user"), ctext)
That looks nice, but wouldn’t it be better if you could tilt the formula on the hypotenuse? You can do this with the srt argument, but you need transform the dimension in the x-y coordinates to the dimension of inches or pixels.
plot(0, 0, xlim=c(0, 20), ylim=c(0, 100), type="n", xlab=" ", ylab=" ")
lines(x=c(x0, x2, x2, x0), y=c(y0, y0, y2, y0))
text(x1, y0-1.5*strheight("a", units="user"), "a")
text(x2+1.5*strwidth("b", units="user"), y1, "b")
px.per.xy <- par("cra") / par("cxy")
hyp.angle <- atan2(delta.y*px.per.xy[2], delta.x*px.per.xy[1]) * 180 / pi
text(x1, y1+1.5*strheight(ctext, units="user"), ctext, srt=hyp.angle)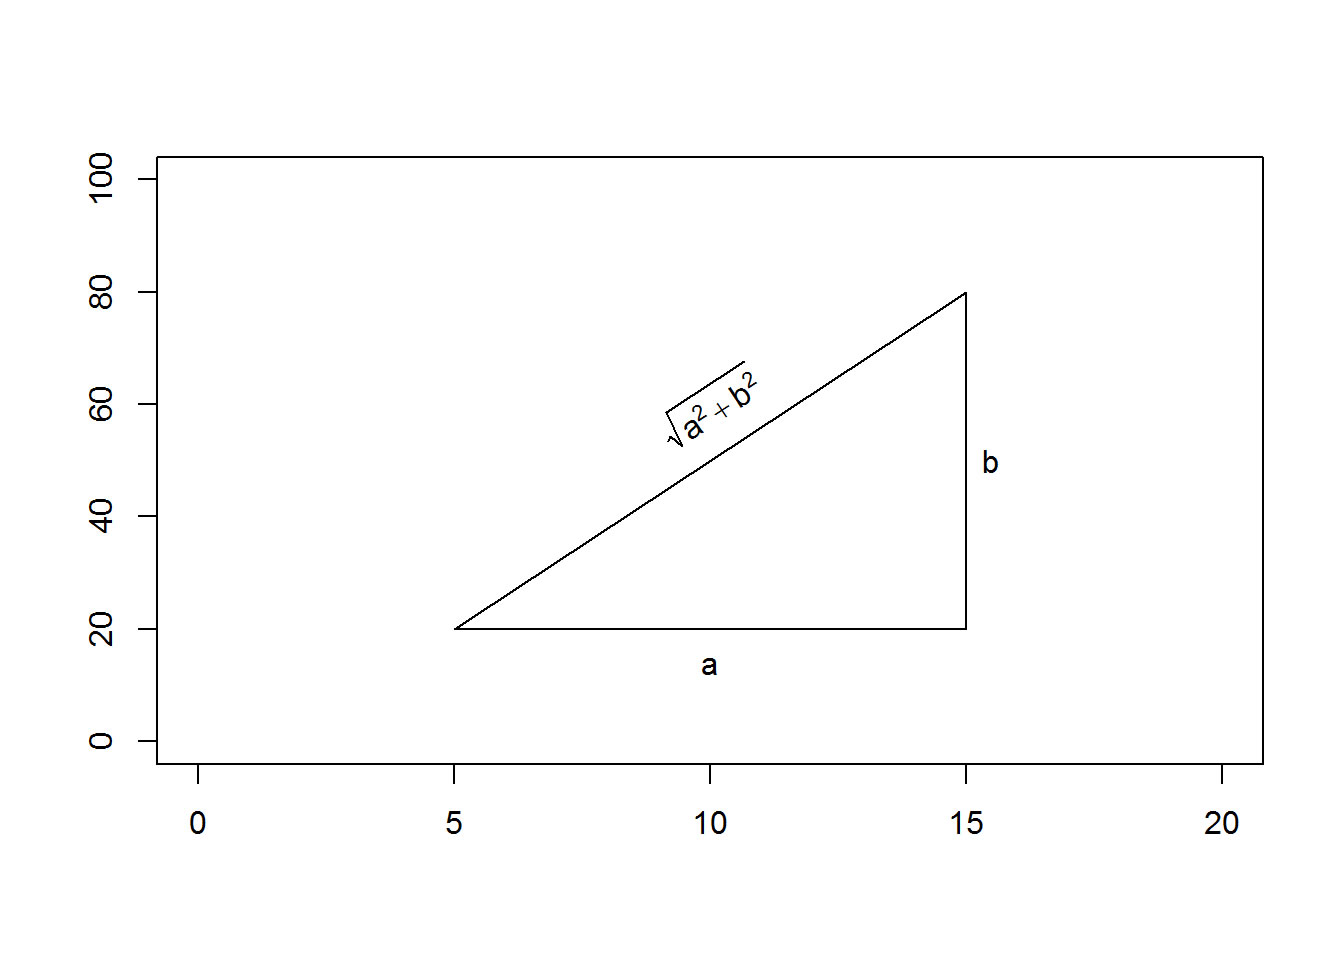
Let’s look at the conversion in detail. If you calculated the slope in x-y coordinates, you would get an angle of 81 degrees. That’s because in x-y coordinates, the line is very steep. The horizontal distance is only 10 units, but the vertical distance is 60 units. But when you look at the graph on the screen, the horizontal distance looks to be almost twice as big as the vertical distance. That’s because there are 51 pixels for each unit in the x direction and 6 pixels for each unit in the y direction. That means that you have 512 horizontal pixels and 337 vertical pixels. The arctangent in pixels will give you an angle of 33 degrees.